A brief introduction to PRESENT
Time series are one of the most important data sources for digital transformation – they show how processes, markets or systems change over time and enable forecasts for the future. However, their use is complex, requiring expertise,
suitable tools and continuous application – a major hurdle, especially for small and medium-sized enterprises (SMEs).
The PRESENT flagship project is developing practical solutions for this: a freely accessible collection of state-of-the-art algorithms for time series analysis, supplemented by training courses, decision-making aids and security concepts.
What makes it special is that all analyses are carried out locally at the company (‘algorithms migrate to the data’), thus ensuring data protection and trade secrets are preserved.
Using three exemplary areas – production (predictive maintenance), healthcare and building management – PRESENT shows how time series analysis can contribute to increased efficiency, better forecasts and early fault detection.
With 20 partners from science and industry, the project is working to develop open, secure and SME-friendly solutions for data-driven predictions by 2026.
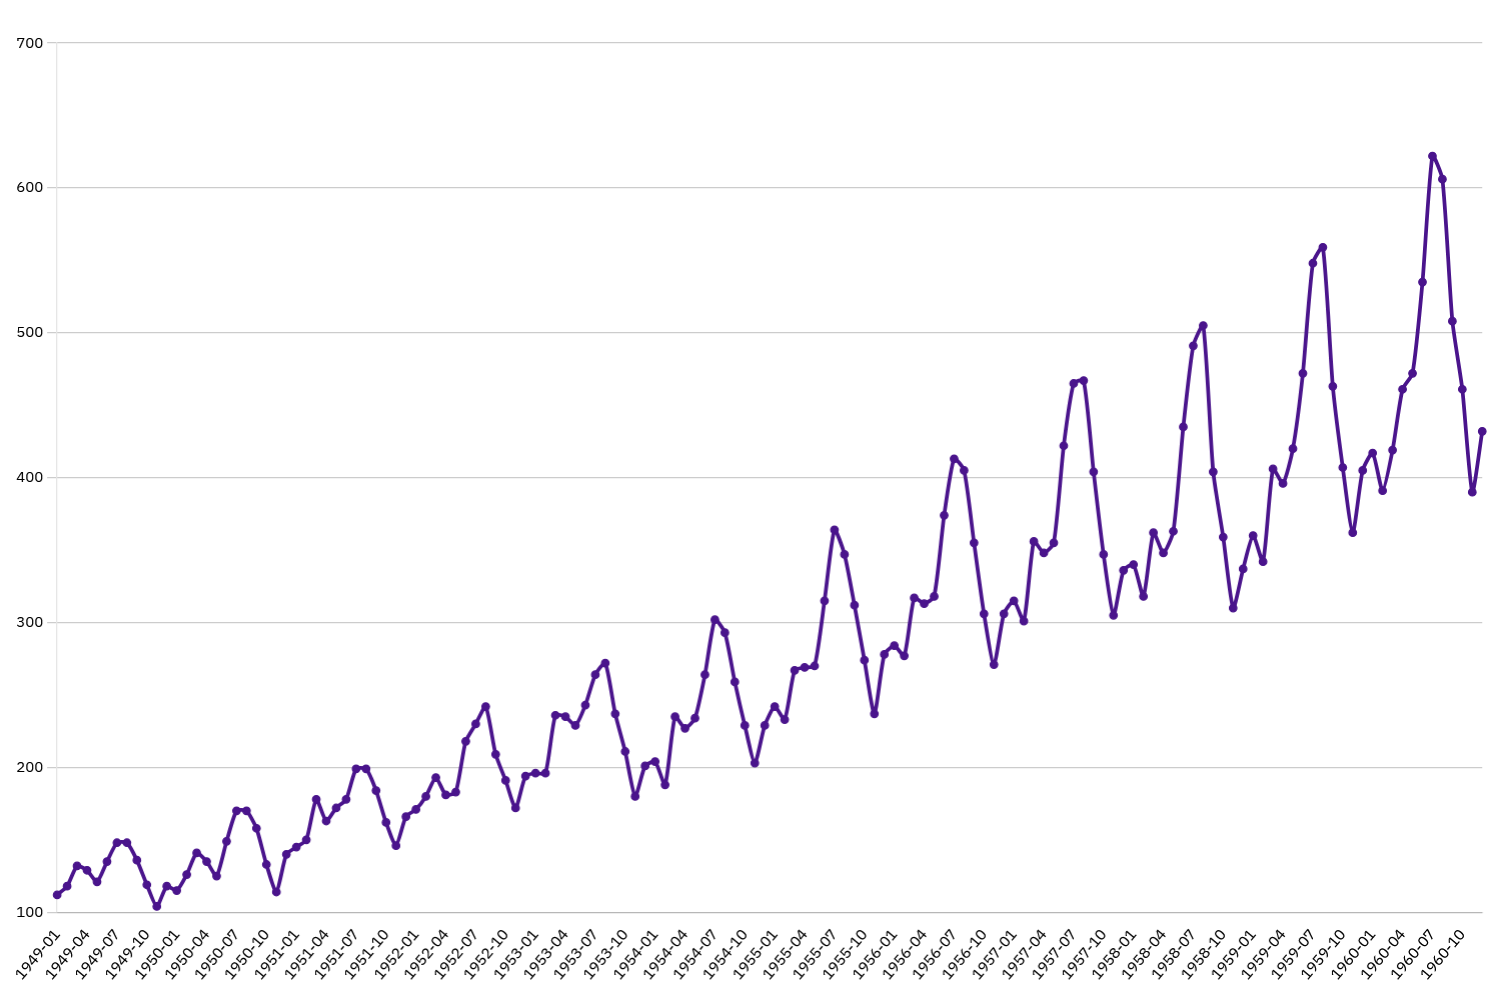
A time series shows how a value changes over time, typically displayed as a sequence of data points on a line chart.
A symbiosis between industry and research.
Industry
Production
Production encompasses the planning, fabrication, assembly, and delivery of goods across discrete and process industries. It relies on complex supply chains, constrained resources, and tightly coordinated schedules. Time series AI helps forecast demand, optimize inventory, or predict machine failures. Furthermore forecasts of energy load support cost-aware production scheduling and reaching sustainability goals.
Medical
Health and medical organizations deliver diagnostics, treatment, and care across clinics, hospitals, and telehealth services. They manage sensitive workflows spanning triage, imaging, labs, pharmacy, and follow-up. Time series AI can be utilized e.g. to anticipate inpatient bed occupancy, patient deterioration, or forecasts of blood products, drugs, and PPE reduce stockouts without excess waste.
Buildings
Facility management oversees buildings, campuses, and critical infrastructure to ensure safety, comfort, and efficiency. Time series AI can predict energy loads to shift usage away from peak tariffs. Occupancy and traffic forecasts inform dynamic cleaning and space allocation. Predictive maintenance on pumps, chillers, and elevators reduces unplanned outages. The result is lower operating cost, higher uptime, and better occupant experience driven by data-centric decisions.
Research
Scientific Partners
The consortium's scientific partners take on board the problems and data collections of the industry representatives involved in the project and use their wealth of knowledge in artificial intelligence, statistics, and big data to develop generalizable solution approaches that make it easier for both the participating companies and the general public to harness the possibilities of time series analysis and data visualization.
Publications
The work of scientific partners on the problems faced by industrial partners gives rise to new approaches and algorithms that can be made available to the industry, the scientific community, and thus the general public through publications, workshops, and events.
Our Special Interests
Forecasting
- Predictive Maintenance
- Resource Planning
- Energy Consumption
Analysis
- Anomaly Detection
- Visualization
- Method-Decision Tree
- Data Maturity Model
Education & Public Relations
- Manuscript
- Slides
- Videos
- Events/Workshops
- RAG-Chatbot
Security Aspects
Legal & Ethics
Selected Results
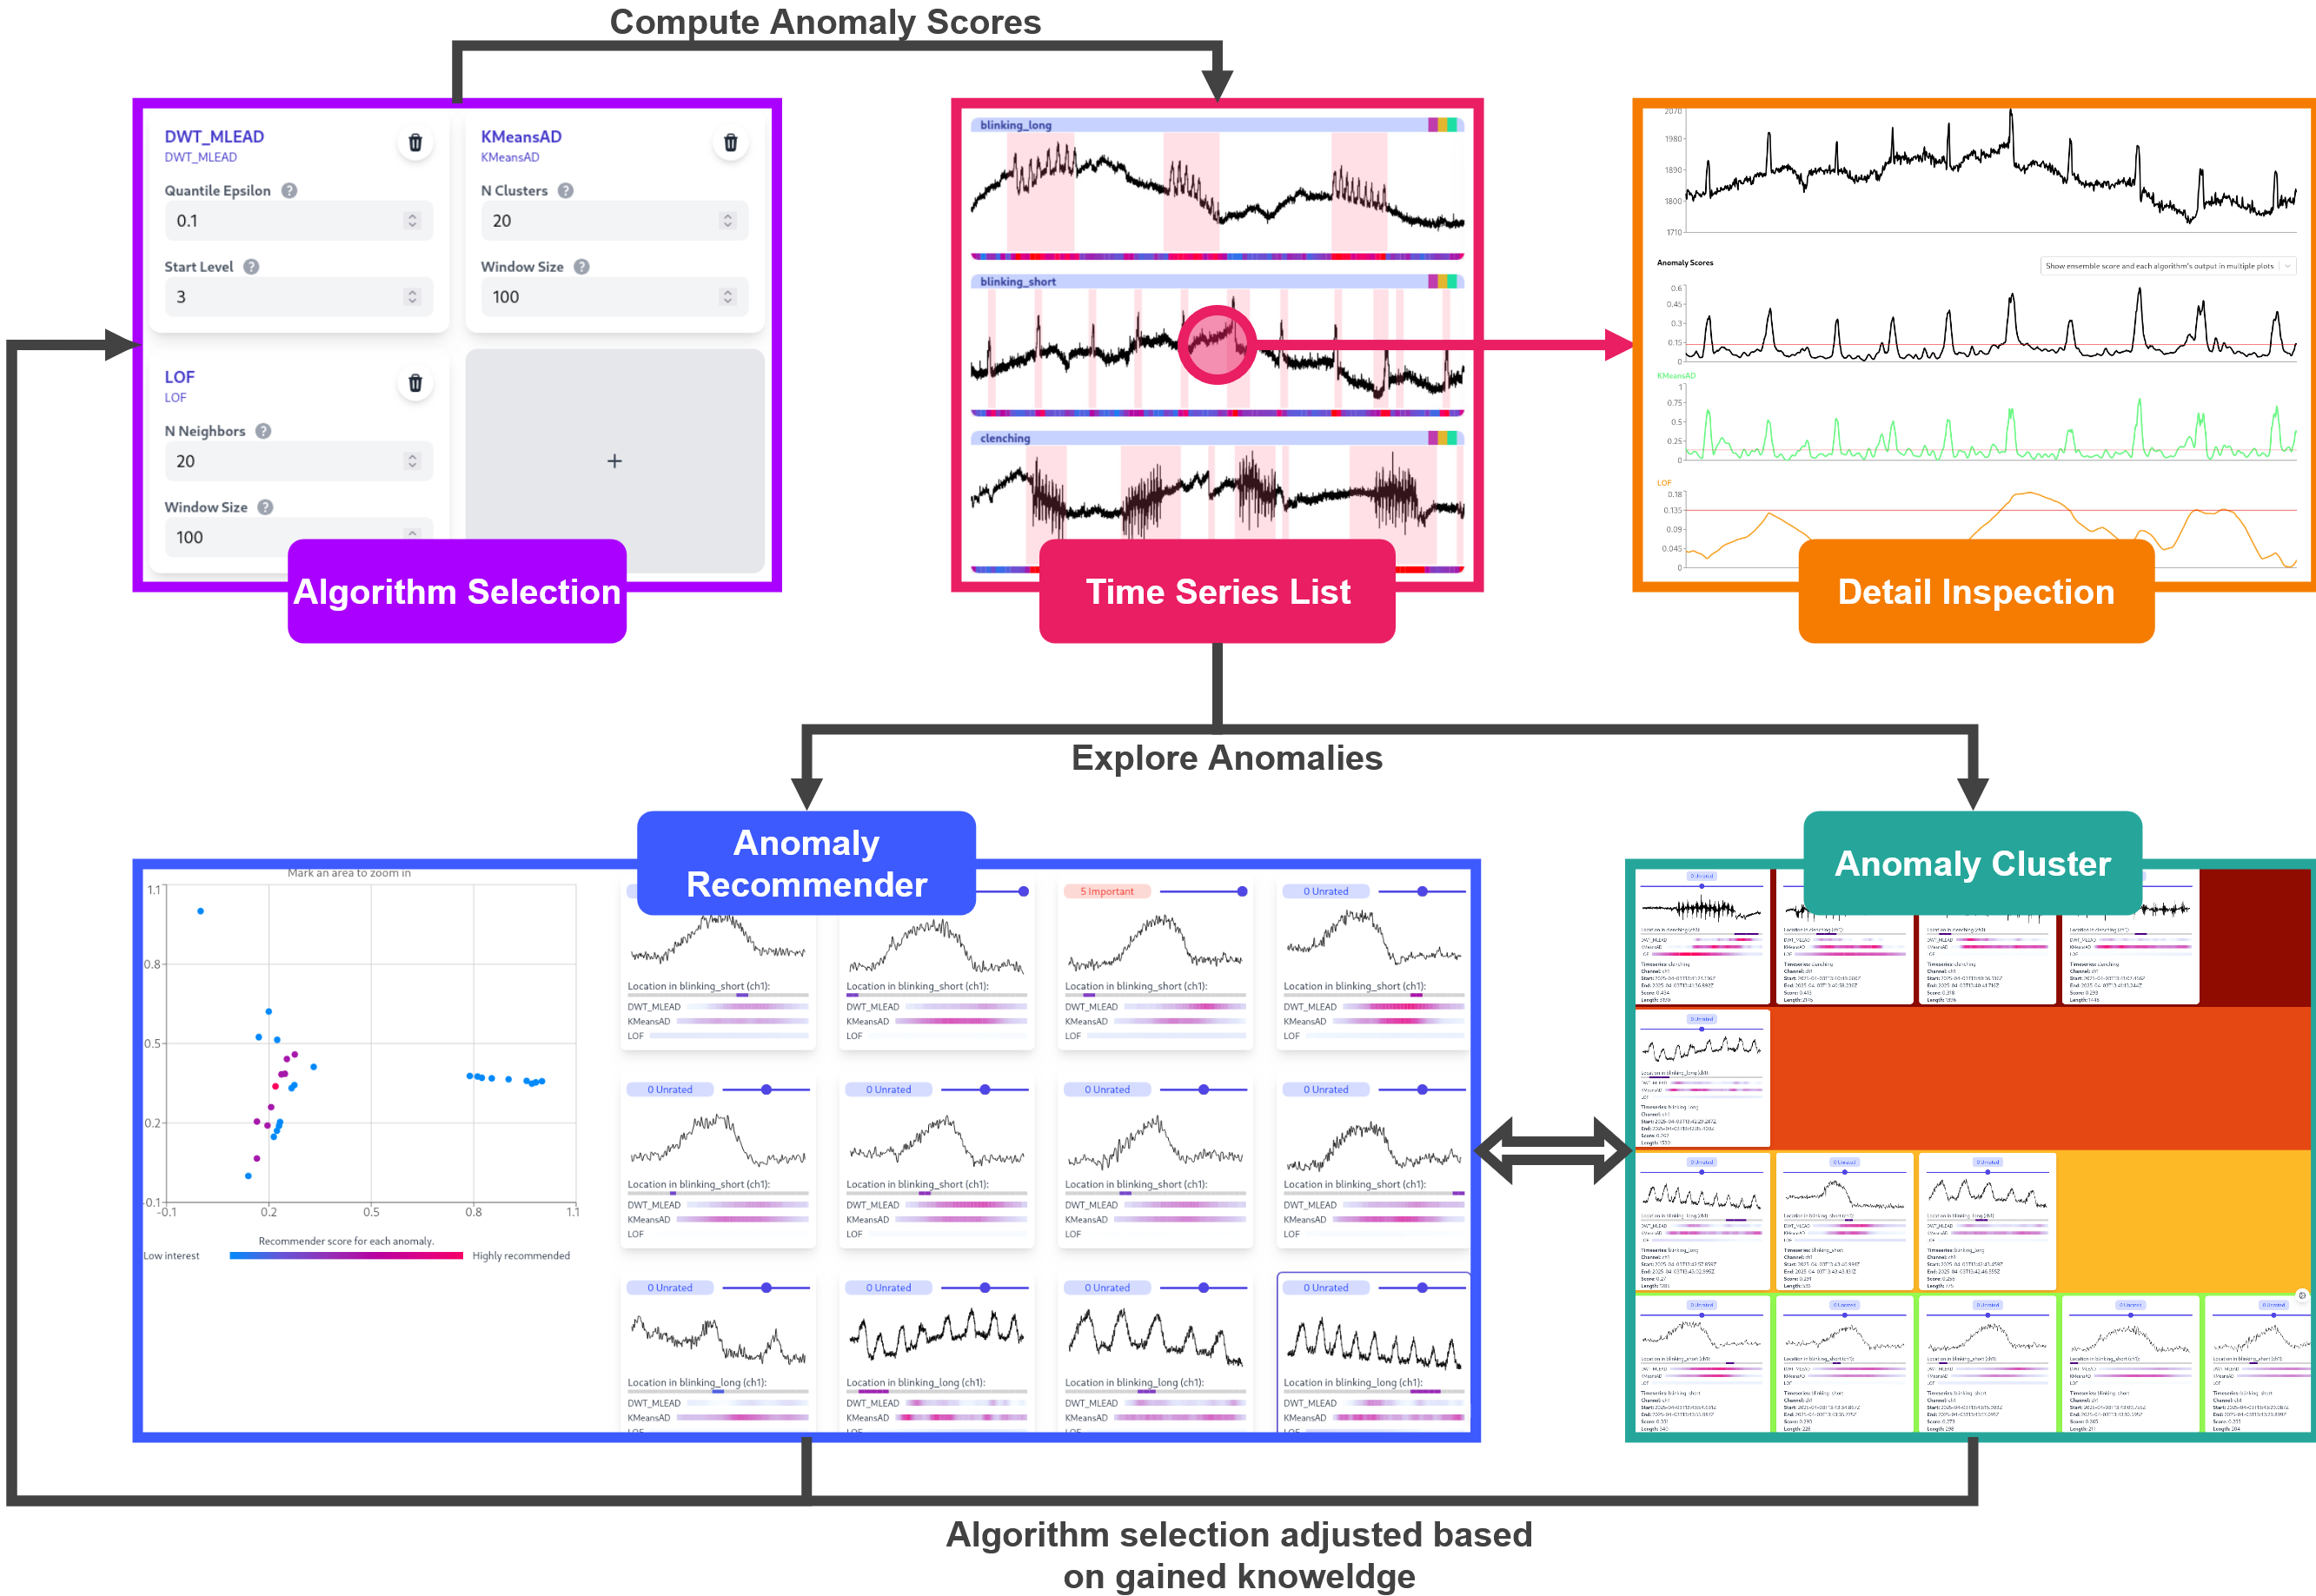
Anomaly Detection Playground
With the growing abundance of time series data and anomaly detection algorithms, selecting appropriate algorithm configurations for a given dataset has become increasingly complex. We introduce AnoScout, a Visual Analytics approach to explore anomalies obtained from an algorithm ensemble with the overall goal of acquiring insights into the diversity of anomalies and identifying appropriate algorithms for each anomaly pattern.

Vibration Fingerprints
Most machines generate vibrations during operation, but effectively visualizing these vibrations is often a challenge, due to large and high-resolution data. Line charts suffer from overplotting, while frequency-domain analysis requires specialized knowledge in signal processing. We introduce a method that bridges the gap between time-domain and frequency-domain analysis: a visual fingerprint computed through the time delay embedding of the vibration data. This fingerprint helps identify segments exhibiting periodic behavior and can be used to cluster similar segments within a vibration signal. Additionally, we demonstrate its practical application in predictive maintenance, showcasing its potential for real-world industrial use.
Guided Time Series Spiral
We present an interactive visual analysis framework centered on a time series spiral visualization. Our approach extends spiral visualizations with visual guidance and dominant periodic trend subtraction to overcome key challenges in analyzing periodic data. Users can select spiral sectors for comparison of subsequences, guided by measures of average, trend, and similarity, and examine them in linked views or a provenance dashboard.

Clustering-Driven Time Series Prediction
When predicting state changes in time series data, the critical information driving these transitions is often absent or difficult to capture. In such cases, similar time series from the same context can be leveraged to fill this information gap. By analysing patterns and dependencies within one time series and identifying corresponding patterns in others, it becomes possible to predict state changes without directly observing the underlying cause. In this setting, clustering time series data can facilitate prediction when not all required data is present. Integrated into a statistical model, built on the core architectural principle of data security, this approach is demonstrated through its application to movement data derived from the log records of a robotic microscope.
Publications
Guided spiral visualization for periodic time series and residual analysis
Rakuschek, J., Hauser, H., Schreck, T.
Computers & Graphics, 2026
AnoScout — Visual Exploration of Anomalies and Anomaly Detection Algorithm Ensembles in Time Series Data
Rakuschek, J., Leitner, M., Bernard, J., Wriessnegger, S., Schreck, T.
VINCI, 2025
Scalable visual exploration of time series and anomalies with adaptive level of detail
Rakuschek, J., Suschnigg, J., Louis, P., Mutlu, B., Schreck, T.
Information Visualization, 2025
Guided Visual Analysis of Time Series Data with Spiral Views and View Quality Measures
Stoppacher, S., Rakuschek, J., Schreck, T.
EuroVA, 2025
Visual Fingerprints of Vibration Signals Using Time Delay Embeddings
Rakuschek, J., Boesze, A., Schmidt, J., Schreck, T.
EuroVis, 2025
Secure Computation and Trustless Data Intermediaries in Data Spaces
Fabianek, C., Krenn, S., Lorünser, T., Siska, V.
CoRR, 2024
Integrating Secure Multiparty Computation into Data Spaces
Siska, V., Lorünser, T., Krenn, S., Fabianek, C.
CLOSER, 2024
Protecting Privacy in Federated Time Series Analysis: A Pragmatic Technology Review for Application Developers
Bachlechner, D., Hetfleisch, R. H., Krenn, S., Lorünser, T., Rader, M.
CLOSER, 2025
Introducing a New Alert Data Set for Multi-Step Attack Analysis
Landauer, M., Skopik, F., Wurzenberger, M.
CSET @ USENIX Security Symposium, 2024
A Critical Review of Common Log Data Sets Used for Evaluation of Sequence-based Anomaly Detection Techniques
Landauer, M., Skopik, F., Wurzenberger, M.
CoRR, 2023
A Review of Time-Series Analysis for Cyber Security Analytics: From Intrusion Detection to Attack Prediction
Landauer, M., Skopik, F., Stojanovic, B., Flatscher, A., Ullrich, T.
International Journal of Information Security, 2025
The Consortium
Coordinator
Contact: Torsten Ullrich
Scientific Partners
Contact: Tobias Schreck

Fraunhofer Austria

Austrian Institute of Technology

Joanneum Research

Technische Universität Graz

Medizinische Universität Innsbruck
Production Partners
Contact: Jakob Olsacher

ARTI – Autonomous Robot Technology GmbH

dankl+partner consulting gmbh

Messfeld GmbH

Sensolligent GmbH

Verein Industrie 4.0 Österreich
Health Partners
Contact: Pascal Mülner


Buildings Partners
Contact: Jacqueline Scherret


Ethics and Integration
Contact: Isabella Hinterleitner


© 2025 PRESENT Project
Web Chair: Julian Rakuschek